How do students experience Blackboard at Wentworth?
Much of the conversation around Blackboard use at Wentworth has focused on how faculty use (or do not use) Blackboard. As we begin an LMS review later this term, we are looking at Blackboard use from the student perspective starting with data we have in Blackboard. Throughout the month of October, we will be collecting preliminary input from students on what they like/dislike about Blackboard, how they perceive Blackboard is being used, and what instructor practices they find most useful regarding Blackboard (and by extension another LMS).
Some interesting information:
On average 72% of the courses students graduating in 2016, 2017 and 2018 completed, used Blackboard to, at a minimum, post content.
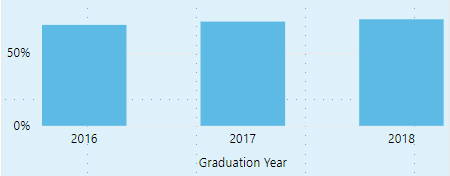
Average Percentage of graduating seniors courses that used Blackboard to, at a minimum, post content.
If one defines Blackboard use as more than posting content, the average percentage of the classes these students experienced using Blackboard drops to 53%.
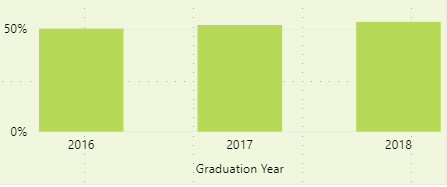
The average percentage of graduating seniors classes that used Blackboard for more than posting content.
Traditional undergraduates logged into Blackboard during the spring semester on average 5.8 times per week. Students in the College of Professional and Continuing Education login slightly less frequently at an average of 5.5 times per week.
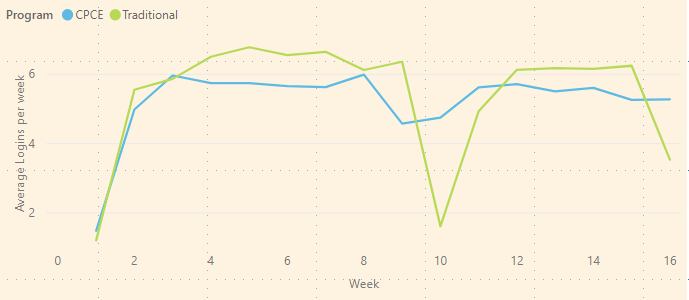
Student logins per week during the spring 2018 term
In contrast, while Students from the College of Professional and Continuing Education login slightly less frequently than traditional students, they are much more active in Blackboard. During the spring 2018 term, students in the College of Professional and Continuing Education averaged 63.8 interactions per course per week while traditional undergraduates averaged 15.3 interactions per course per week.
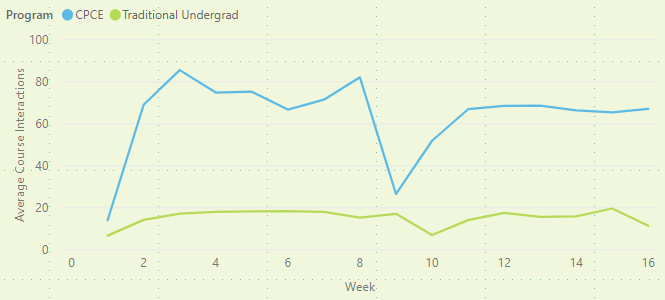
Average student course interactions per course per week – Spring 2018
Students prefer mobile.
Wentworth students prefer mobile devices, 44% of all student logins are using a mobile device while only 2.6% of faculty logins are from mobile devices. Students use an average of 2.4 device/browser combinations. While students use mobile devices to access iOS users are more likely to use the Blackboard app (66%) than Android users (40.1%).
These are a few of the insights we are gleaning from our analysis of the data in Blackboard. As mentioned earlier, LIT will be conducting student polls in Blackboard (two poll questions per week). Based on work with students in Kelly Parrish’s MGMT 3560 class this summer we will be asking students the following:
- Have you used Blackboard before arriving at Wentworth?
- Do your instructors use Blackboard (this term)?
- Do you think Wentworth should provide student training in Blackboard use?
- When/What kind of training should students receive in using Blackboard?
- Have you used the Blackboard support button?
- Do you want your instructors to use Blackboard?
- What could your instructors do on Blackboard to create a better learning experience?
- What Blackboard tool is the most important for your success as a student?
- What Blackboard tool is the hardest for students to use? What are your pain points using Blackboard?
We will also offer two face-to-face focus groups during the month of October for students to share their likes/dislikes/rants/raves about Blackboard with us. We will also provide some virtual sessions to extend the opportunity to CPCE students who may not be able to attend on campus sessions.
Do we have a way to identify CPCE 7 week courses as a distinct data set? It would be interesting to see if the number of interactions is so much higher because the course time frame is so much more compressed and it would be helpful to me as an instructor to see the pattern of logins over a 7 week period. Very interesting data. Thanks for sharing it.