In an earlier post, I discussed how Blackboard weights grades – something that can lead to confusion and suspicion that the system is not calculating grades correctly. Because we are changing Learning Management Systems (LMS), I’m revisiting this topic this time using Brightspace as the reference system.
In my previous post, I discussed the sticky business of defining what is meant by “average” and explained how Brightspace average columns calculate an unweighted average. In this post, I’ll discuss how are weighted columns calculate.
Just as in Blackboard, you can use a combination of categories and items in a weighted grade. However, unlike Blackboard, in Brightspace you specify how items are weighted in a category when you set up the category. You’ll also have the option to drop grades in Brightspace, just as you did in Blackboard, but again, this is configured in the category, not in the column configuration.
Let’s look at an example:
- Category – Term Project (250 pts)
- Topic statement – 10 pts
- Project Plan 40 pts
- Status Report 1 10 pts
- Status Report 2 10 pts
- Status Report 3 10 pts
- Project Presentation 50 pts
- Final Project Paper 100 pts
- Category – Tests (300 pts)
- Midterm – 100 pts
- Final – 200 pts
- Weekly Quizzes (150 pts) – 15 quizzes 15 pts each, drop 5 lowest.
- Category (100 pts) – Participation (14 weeks, 10 pts each week, drop 4 lowest – 10 scores used)
- Category (200 pts of final grade) – Homework – 11 homework assignments 20 points each, drop lowest score – 10 scores used
Homework is a simple calculation – an average of 8 scores counting for 15% of the grade.
In Brightspace here’s how we’d set that up: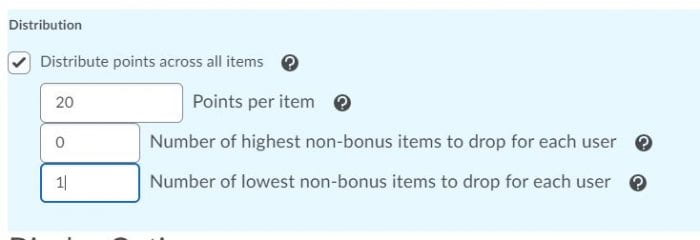
The Project is trickier. The point values are all different, should the grades be normalized (divided by the points possible) before averaging or should the average be calculated based on points – giving more weight to the final paper than the other parts of the assignment?
[(Topic/10) + (Plan/40) + (Status Report1/10)+(Status Report2/10)+(Status Report3/10) + (Presentation/50) + (Final Paper/100)] ÷ 7 grades (Equally weighted)
Or
(Topic + Plan + Status Report1 +Status Report2 + Status Report3 + Presentation + Final Paper) ÷ 250 points (Proportionally weighted)
In this example, we’ll weight the grade based on the points. To do that in Brightspace, leave the distribution section blank section blank, you’ll add the points per assignment/item.
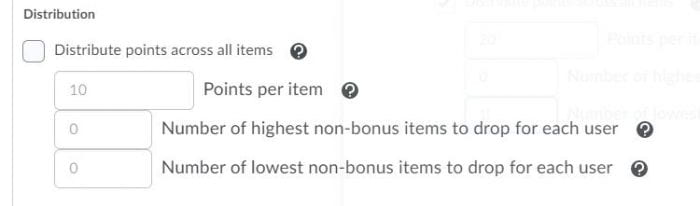
The Tests category is like the project, the points are different. Again, to weight or normalize? Again, we’ll choose to weight based on the point values and leave the distribution section blank.
Finally, participation is like homework, all the entries will carry the same point value and will be weighted equally – an average of 10 grades counting for 10% of the grade. The only difference between participation and homework, there are four dropped grades.
In the Manage Grades screen you will see the breakdown of the grades:
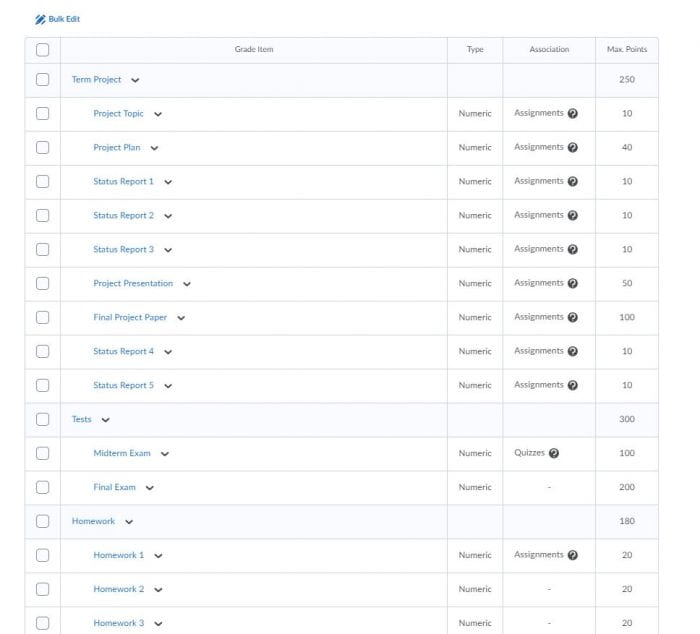
You’ll notice in the Homework category, there are only 180 points – I have not added all the columns. When the last column is added, the category point value should be 200 points.
In this example we’ve seen how to create a points based grade book that allows for flexible grade calculation using the Brightspace GradeBook. We’ve used proportional and equal weighting and dropped grades. Brightspace can calculate grades just about any way you want. In my next installment, I’ll look at simplifying calculations and the benefits to instructors and students.