In my previous post, I discussed the sticky business of defining what is meant by “average” and explained how Blackboard average columns calculate an unweighted average. In this post, I’ll discuss how are weighted columns calculate.
In the weighted column edit window, you’ll choose columns and categories to add the columns and categories to the calculation and indicate how much weight each should contribute. If you use categories, you’ll have the option to drop grades, or weight individual items in the category either equally or proportionate to the point value.
Let’s look at an example:
- Category – Final Project (30%)
- Topic statement – 5 pts
- Annotated Bibliography -10 pts
- Outline – 10 pts
- Draft – 25 pts
- Final – 50 pts
- Category – Tests (45%)
- Midterm – 100 pts
- Final – 200 pts
- Category (10%) – Participation (14 weeks, 10 pts each week, drop 4 lowest – 10 scores used)
- Category (15 % of final grade) – Homework – 7 homework assignments 10 points each, drop lowest score – 6 scores used
- Week 1
- Week 3
- Week 5
- Week 7
- Week 9
- Week 11
- Week 13
Homework is a simple calculation – an average of 6 scores counting for 15% of the grade.
The Project is trickier. The point values are all different, should the grades be normalized (divided by the points possible) before averaging or should the average be calculated based on points – giving more weight to the final paper than the other parts of the assignment?
[(Topic/5) + (Biblio/10) + (Outline/10) + (Draft/25) + (Final/50)] ÷ 5 grades (Equally weighted)
Or
(Topic + Biblio + Outline + Draft + Final) ÷ 100 points (Proportionally weighted)
In this example, we’ll weight based on the points and select proportional weighting.
The Tests category is like the project, the points are different. Again, to weight or normalize? Again, we’ll choose to weight based on the point values and select proportional weighting for the column.
Finally, participation is like homework, all the entries will carry the same point value and will be weighted equally – an average of 10 grades counting for 10% of the grade.
In Blackboard, this is how we’d set this up:
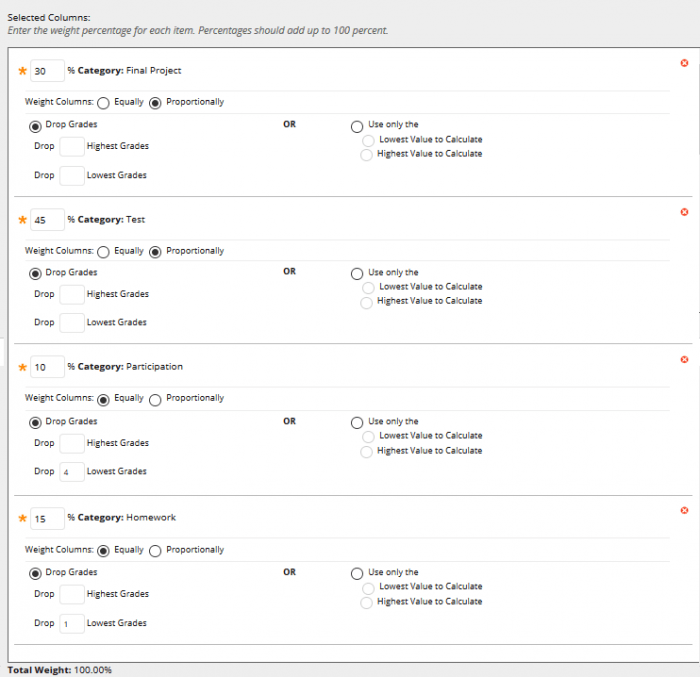
Settings for Weighted Column
In this example we’ve seen how to create a weighted column that allows for a complex grade calculation using the Blackboard Grade Center. We’ve used proportional and equal weighting and dropped grades. Blackboard can calculate grades just about any way you want. In my next installment, I’ll look at simplifying calculations and the benefits to instructors and students.