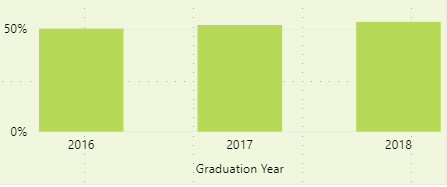
Bar graph that shows the average percentage of student’s classes that used Blackboard for more than posting content.
Class of 2016 – 52%
Class of 2017 – 53%
Class of 2018 – 55%
Bar graph that shows the average percentage of student’s classes that used Blackboard for more than posting content.
Class of 2016 – 52%
Class of 2017 – 53%
Class of 2018 – 55%