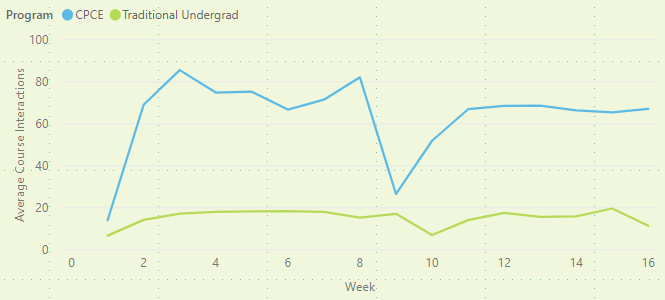
Graph showing average student interactions with courses, x axis is week of the spring 2018 semester, and y axis is the average number of interactions per course.
There are two lines one for students in the College of Professional and Continuing Education in blue and traditional undergrads in green.