Rethinking the Way College Students are Taught

Image result for teaching styles

Learners often express preferences about how they would like to receive information – by reading, hearing or doing – and these are often referred to as ‘learning styles’. Many teachers believe that assessing learning styles and teaching to learners’ preferences will improve learning.

While your students may have a preference, they also use different styles depending on the type of content being taught. For example, if you are teaching an engineering course that requires diagrams and visuals, student adapt their style to use their visual skills, because this makes the most sense and the best way to learn the content. However, students may need additional content using their preferred learning style to reinforce and/or drive home the new knowledge – reading – hands on activities – opportunities to reflect and have discussions with their peers. These teaching strategies provide additional support for your students.

By using a more student-centered approach to your teaching, students are encouraged to be more independent, and have more autonomy over their learning. Student engagement provides an environment which enables them to focus on their learning style and adapt to new knowledge that works for them.

Read More: Rethinking the Way College Students are Taught

Post Course Copy House Cleaning Tips

Reminder: Once you’ve copied a past course into the current term, while most of your prep work is done, you are not quite finished. There are some important housekeeping items to remember:

    1. Check Content and assessment items and revise/replace them as needed. Make sure content is in the appropriate location. Consult your department for any specific requirements.
    2. Run the Date Management tool, correct due dates, and release dates associated with items. Documentation for Date Management
    3. Use Link Checker tool to Check all External Links Documentation for Link Checker
    4. Check all links embedded in content items – Link Checker does not check these links.
    5. Check YouTube and other Mashup Content, is the media still available? Choose replacements as needed. Check other third-party content like Atomic Learning and Lynda/Linkedin Learning videos, too. As we refine the academic technology toolkit, some tools may be replaced and content will also need to be replaced.
    6. Grade Center Clean-Up – Remove (don’t just hide) any unneeded columns (from quizzes/tests/assignments that have been removed) and make sure grade calculations include the correct columns/categories and weighting. If you are adding assignments, make sure the grades calculate properly. CPCE courses are based on 1000 points. Added assignments can inflate this value.
    7. Remove any grading Schemas not in use. Wentworth changed its undergraduate grade schema starting in Fall 2018. If you’ve copied your course, you may have copies of the older schema that can impact how grades are displayed in your course.
    8. Check to make sure settings on Discussion Forum are appropriate for your course and allow students to create new threads. We discourage allowing students to delete their own posts because most online and hybrid courses require students to reply to other students’ posts and deleting posts with replies could impact the grades of other students.

This information is available as a pdf.

Follow these steps and you’ll be off to a good start of the semester.

Exam Security – LockDown Browser Available

Do you use the testing system in Blackboard? Are you looking for a way to prevent students from browsing websites or using other applications during a Blackboard test/quiz? If so, we have a tool for your students. LockDown Browser is a special application that runs on a student’s computer that locks them into a Blackboard test. The student can’t browse other websites, other parts of Blackboard, or use other applications on their computer. They can’t print the exam or copy and paste the questions into email to send to other students.

How do you get this wonder for your course? It’s already in your course. We have added this tool in Blackboard and it is available to instructors in the control panel. After you create your test/quiz using the regular Blackboard tools, you will deploy the test/quiz as usual. Up to this point there is no change. To use LockDown Browser, you navigate to the Course Tools section. There you will find a link for “Respondus LockDown Browser.”

LockDownBrowser Link on Blackboard Control Panel

LockDownBrowser Link on Blackboard Control Panel

Clicking on the link brings you to an about Lockdown Browser page with a video introducing LockDown Browser and a companion product, Respondus Monitor (which Wentworth does not currently license). Click on the Continue to LockDown Browse button to continue setting up a test to use LockDown Browser.

LockDown Browser Button

Once on the LockDown Browser page you can open the settings for any test and indicate whether students will be required to use LockDown Browser to access the test.

Menu to LockDown Browse Settings in Blackboard

Accessing LockDown Browse Settings in Blackboard

On the settings page, you select the option to require LockDown Browser and any options that you want.

LockDown Browser - All settings

LockDown Browser – All settings

On the settings page, you can select LockDown Browser as a requirement and allow access to some tools that might be needed for the exam – such as a calculator.
Click Save + Close when done and you have made LockDown Browser a requirement for your exam.

But Wait, there’s more… Before having students take their first test with LockDown Browser, you should plan on having students download, install and test the set-up using a practice test. LIT/TechSpot can come to class to troubleshoot any problems in advance of any real tests so that instructors and students can be confident the system will work.

During the fall term we piloted LockDown Browser with a few courses with success.  LIT wants to assist any other instructors interested in using this product to administer exams. There are specific best practices around testing with LockDown Browser and we’d like to help you with your first experiences to make them as problem free as possible.

If you are interested in using LockDown Browser with your course, please contact LIT at lit@wit.edu and we’ll be happy to schedule a consultation.

Just Because You Can Doesn’t Mean You Should — Part 3: Simplifying Grading

In parts 1 and 2 we looked at how Blackboard calculates grades and how it can accommodate complex grading systems. In part 3 I’m going to advocate for simpler grading systems. I’ve heard the argument that calculating grades is simple math that every student should be able to do. And while I agree in principle that the math is easy, exactly how the grade is calculated can get messy fast.

Consider the following grade calculation:

  • Homework – 12 assignments (3 – 10 points, 3 – 12 points, 3 – 5 points, 3 – 15 points), lowest two scores dropped – 10%
  • Midterm exam (100 points) – 20%
  • Quizzes – 5 reading quizzes (3 – 5 points, 2 – 8 points), lowest score dropped – 10%
  • Term Project – project description (5 points), bibliography (10 points), draft (15 points), final paper (40 points) – 30%
  • Final Exam (200 points) – 30%

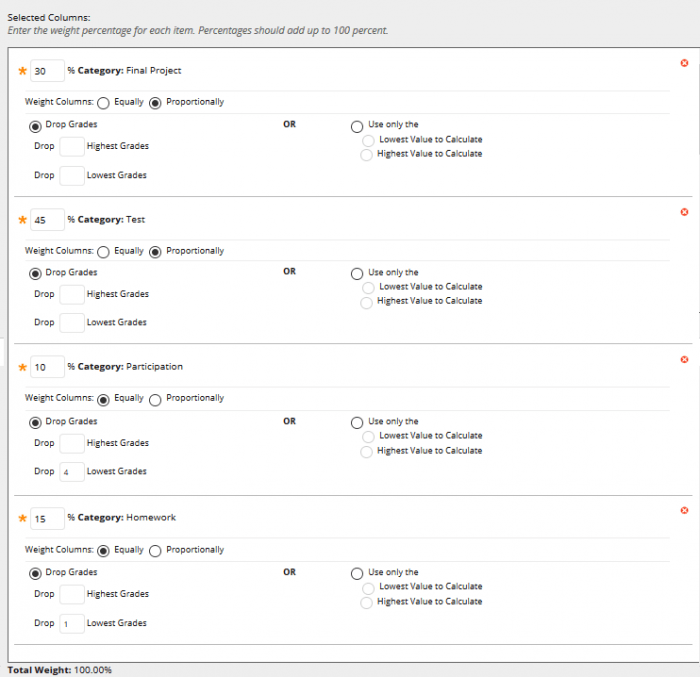
Here are some confusing points – the homework and quizzes consist of multiple grades of different possible point values, with lowest in the category dropped. A student needs to calculate the percent score to determine which are the lowest grades. Next, are the scores averaged equally or weighted to arrive at the score contributing to the final grade? Similarly, the project components have different point values, this suggests the project score is calculated out of 70 possible points, but is it? Again, there’s ambiguity around weighting.

And while the calculation above could be clarified by indicating when scores are averaged, how they are weighted, the complication leads to uncertainty, both for instructors and students. Instructors need to be certain that the grades that are calculated are correct – that is, Blackboard is calculating the grade as intended. With such a complicated grade calculation, it’s easy to miss an equally weighted calculation for a weighted one unless you manually check the calculations.  For students, the uncertainty that comes with complicated calculations means they often want to meet with the instructor to confirm that their calculations are correct, resulting in more meetings with students to verify how they are doing.

Many years ago, when I was teaching, I used a grade calculation much like the example above. I chose that calculation for no other reason than that’s how other instructors I was teaching with calculated their grades and it made sense to be consistent across sections. I never gave much thought to why at the end of the semester so many students wanted to meet with me to see “how they were doing.” I provided the breakdown of grades so that they could calculate the grade themselves but every term the same requests for meetings. I now realize that I wasn’t always clear around averaging – were the quizzes weighted averages or not.

More recently I’ve worked with faculty in our continuing education program and have been won over to the simplicity of the grade calculations they use for online and hybrid courses. All final grades are calculated out of 1000 points. Instructors can see if they have too many or not enough grades in a category or if a grade column is missing – the total column lists how many points are possible providing an indicator of missing (or too many grade columns). Students can easily see how each assignment contributes to their final grade and can use that information in planning their work.

Since we’re just talking basic math, how might the calculation above be converted to 1000 points?

One interpretation is as follows:

  • Homework – 12 assignments (10 points each), lowest two scores dropped – 100 points
  • Midterm exam – 200 points
  • Quizzes – 5 reading quizzes (25 points each), lowest score dropped – 100 points
  • Term Project – project description (20 points), bibliography (40 points), draft (70 points), final paper (170 points) – 300 points
  • Final Exam – 300 points

Because the initial conversion created grades for the project components that were not round numbers, I adjusted them to be easier to add up to 300 points without a calculator. I also chose to make all the homework and quiz grades equal to make dropping the scores easier, the final value used was derived from overall category value (weight) divided by the number of scores counted in the final calculation.

In Blackboard you can view the grade columns (Full Grade Center>Manage>Column Organization), the categories each column contributes to and points possible:

The Column Organization screen has useful information that can be used to identify errors in a gradebook.

Column organization screen in Blackboard

In the last 6 columns the calculation comes together – Homework and Quiz totals are the totals after dropping grades. The Term Project column is the aggregate score for the items making up the project. I created that column as a double check on the calculation – the components add to 300 points, so I’ve correctly specified the points.  The Final Grade is out of 1000 points, I haven’t missed anything or added columns into the calculation that I don’t want to include. Note, the statement “may vary by student” indicates that if each student receives a grade for all the items, the total will be accurate. If you exempt a grade in the category the grade total may vary.  You need to determine how the grades will calculate if you exempt grades.

In this series, I have discussed how Blackboard columns calculate, how to set up complex grade calculations using the Grade Center, and finally, how to convert a complex calculation to a point totaling system that is easier to troubleshoot mistakes, easier for students to understand, and can reduce student requests to “check their grade” near the end of term.

Stop by Learning Innovation & Technology in Beatty 318 for assistance with your grade center or email lit@wit.edu.

Weighty Matters – Part 2: Using Weighted Grade Columns

In my previous post, I discussed the sticky business of defining what is meant by “average” and explained how Blackboard average columns calculate an unweighted average. In this post, I’ll discuss how are weighted columns calculate.

In the weighted column edit window, you’ll choose columns and categories to add the columns and categories to the calculation and indicate how much weight each should contribute. If you use categories, you’ll have the option to drop grades, or weight individual items in the category either equally or proportionate to the point value.

Let’s look at an example:

  • Category – Final Project (30%)
    • Topic statement – 5 pts
    • Annotated Bibliography -10 pts
    • Outline – 10 pts
    • Draft – 25 pts
    • Final – 50 pts
  • Category – Tests (45%)
    • Midterm – 100 pts
    • Final – 200 pts
  • Category (10%) – Participation (14 weeks, 10 pts each week, drop 4 lowest – 10 scores used)
  • Category (15 % of final grade) – Homework – 7 homework assignments 10 points each, drop lowest score – 6 scores used
    • Week 1
    • Week 3
    • Week 5
    • Week 7
    • Week 9
    • Week 11
    • Week 13

Homework is a simple calculation – an average of 6 scores counting for 15% of the grade.

The Project is trickier. The point values are all different, should the grades be normalized (divided by the points possible) before averaging or should the average be calculated based on points – giving more weight to the final paper than the other parts of the assignment?

[(Topic/5) + (Biblio/10) + (Outline/10) + (Draft/25) + (Final/50)] ÷ 5 grades    (Equally weighted)

Or

(Topic + Biblio + Outline + Draft + Final) ÷ 100 points      (Proportionally weighted)

In this example, we’ll weight based on the points and select proportional weighting.

The Tests category is like the project, the points are different. Again, to weight or normalize? Again, we’ll choose to weight based on the point values and select proportional weighting for the column.

Finally, participation is like homework, all the entries will carry the same point value and will be weighted equally – an average of 10 grades counting for 10% of the grade.

In Blackboard, this is how we’d set this up:

Screen shot from Bb showing settings for weighted column.

Settings for Weighted Column

In this example we’ve seen how to create a weighted column that allows for a complex grade calculation using the Blackboard Grade Center. We’ve used proportional and equal weighting and dropped grades. Blackboard can calculate grades just about any way you want. In my next installment, I’ll look at simplifying calculations and the benefits to instructors and students.